Venn diagram for weather and climate – In the realm of meteorology, the distinction between weather and climate is often explored through the use of Venn diagrams. This powerful visual tool allows us to discern the unique characteristics and overlapping aspects of these two closely intertwined phenomena.
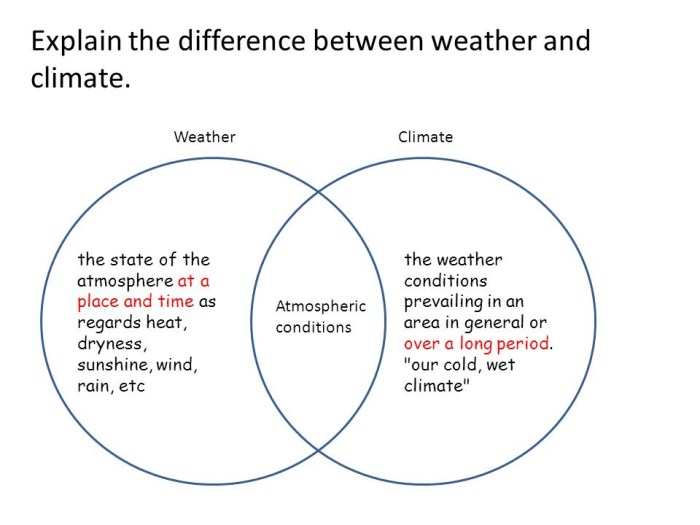
Weather, characterized by its short-term variability, encompasses the current state of the atmosphere, including temperature, precipitation, and wind. Climate, on the other hand, represents long-term patterns and averages of these atmospheric conditions, providing a broader perspective on the Earth’s weather systems.
Venn Diagram Elements

A Venn diagram is a graphical representation that shows the relationships between different sets of data. It consists of two or more overlapping circles, with each circle representing a different set.
Two Main Circles
The two main circles in a Venn diagram represent the two sets being compared. The area inside each circle represents the elements that are unique to that set. The area outside both circles represents the elements that are not in either set.
Overlapping Area
The overlapping area between the circles represents the elements that are common to both sets. This area is often referred to as the intersection of the sets.
Example
For example, consider a Venn diagram that compares the sets of students who like math and those who like science. The area inside the math circle represents the students who like only math. The area inside the science circle represents the students who like only science.
The overlapping area represents the students who like both math and science.
Weather vs. Climate

Weather refers to the short-term state of the atmosphere at a specific location, characterized by elements such as temperature, precipitation, humidity, wind speed, and direction. It can change rapidly over hours or days.
Climate, on the other hand, encompasses the long-term average weather patterns and trends in a particular region. It is determined by factors such as latitude, altitude, proximity to oceans, and prevailing wind patterns. Climate patterns typically persist over decades or even centuries.
Factors Influencing Weather
- Temperature:The measure of the warmth or coldness of the air, influenced by solar radiation, air masses, and wind.
- Precipitation:Any form of water falling from the atmosphere, including rain, snow, sleet, or hail.
- Wind:The movement of air, caused by differences in atmospheric pressure and temperature.
- Humidity:The amount of water vapor in the air, affecting temperature perception and precipitation formation.
Long-Term Patterns Defining Climate, Venn diagram for weather and climate
- Temperature Averages:The mean temperature over an extended period, influenced by factors such as latitude and proximity to oceans.
- Precipitation Patterns:The average amount and distribution of precipitation throughout the year, influenced by wind patterns and topography.
- Wind Patterns:The prevailing wind directions and speeds, affecting temperature, humidity, and precipitation.
- Climate Variability:The natural fluctuations in climate patterns over time, caused by factors such as El Niño-Southern Oscillation (ENSO) and solar activity.
Overlapping Aspects of Weather and Climate

Weather and climate, though distinct concepts, share certain commonalities. Weather refers to the short-term atmospheric conditions in a specific location, while climate describes the long-term patterns of weather in a region. Despite their differences, weather and climate are interconnected, with short-term weather events potentially influencing long-term climate patterns.
Short-Term Weather Events and Long-Term Climate Patterns
Extreme weather events, such as hurricanes, heat waves, and droughts, can have significant impacts on climate. These events can alter local ecosystems, disrupt human activities, and release substantial amounts of greenhouse gases into the atmosphere. Over time, the accumulation of these effects can contribute to changes in global climate patterns.
Climate Change and Weather Patterns
Conversely, climate change can also affect weather patterns. Rising global temperatures are leading to more frequent and intense extreme weather events. For instance, warmer ocean temperatures contribute to the formation of stronger hurricanes, while changes in atmospheric circulation patterns can lead to more frequent heat waves and droughts.
These altered weather patterns can have devastating consequences for ecosystems, infrastructure, and human populations.
Creating a Venn Diagram for Weather and Climate

A Venn diagram is a graphical representation of the relationship between two or more sets. It can be used to show the similarities and differences between two concepts, such as weather and climate.
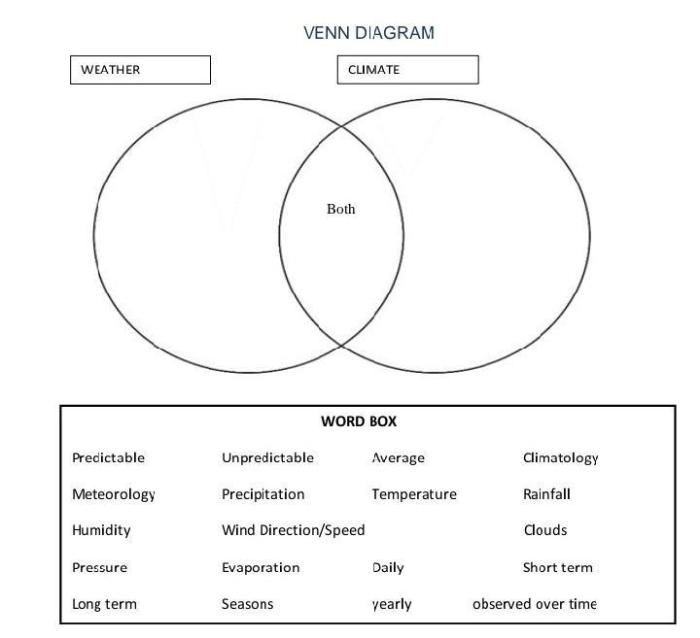
To create a Venn diagram for weather and climate, you will need to draw two circles that overlap. The left circle should be labeled “weather” and the right circle should be labeled “climate”. The overlapping area should be labeled “weather and climate”.
You can use different colors or shading to distinguish the two circles and the overlapping area. For example, you could use blue for weather, red for climate, and purple for weather and climate.
Once you have created your Venn diagram, you can start to fill it in with information. The weather circle should contain information about the short-term state of the atmosphere, such as temperature, humidity, and precipitation. The climate circle should contain information about the long-term average of weather conditions in a particular area.
The overlapping area of the Venn diagram should contain information about the aspects of weather and climate that are related. For example, you could include information about how weather can affect climate, or how climate can affect weather.
A Venn diagram can be a helpful tool for visualizing the relationship between weather and climate. It can help you to understand the similarities and differences between the two concepts, and how they are related.
Examples and Applications of the Venn Diagram

The Venn diagram provides a valuable tool for analyzing and visualizing the complex interactions between weather and climate. Its applications extend to various fields, including research, policymaking, and public communication.
Real-World Examples
Researchers utilize Venn diagrams to identify patterns and relationships in weather and climate data. For instance, a study comparing weather patterns in different regions may reveal overlapping characteristics that influence local climates. Policymakers employ Venn diagrams to assess the potential impacts of climate change on specific sectors, such as agriculture or infrastructure, by identifying vulnerabilities and areas of overlap.
Communication to the Public
Venn diagrams offer an effective means of communicating complex weather and climate information to the public. By visually representing the similarities and differences between weather and climate, the diagram simplifies the understanding of these concepts. It helps individuals grasp the dynamic nature of weather and the long-term trends associated with climate.
FAQ: Venn Diagram For Weather And Climate
What is the difference between weather and climate?
Weather refers to the short-term state of the atmosphere, while climate represents long-term patterns and averages of atmospheric conditions.
How does weather influence climate?
Short-term weather events can contribute to long-term climate patterns, such as extreme precipitation events leading to changes in regional rainfall patterns.
How does climate change affect weather patterns?
Climate change can alter the frequency and intensity of weather events, leading to more frequent heatwaves, droughts, and storms.